
Technology
Platforms. One signal path.
Everything below starts as a current at an electrode and ends as a decision. These are the places where UCARETRON does the hard part — and where OmniGram, our knowledge engine, helps design the hardware behind them.
Every platform is described in the same seven slots — what it does, why it matters, how it works, its parameters, its applications, its evidence — and each has an instrument you can turn a knob on. Those instruments compute textbook models live; none of them is measured data. How to read a claim →
Platform 01
Electrochemical Impedance Spectroscopy
Ultra-low power, ultra-compact impedance measurement. The world’s smallest, widest-band (0.1–200 kHz) Cortex‑M4 intelligent impedance chip.
A single-frequency reading tells you the electrode changed. A spectrum tells you which part of it changed — solution, interface, or diffusion — because each lives in a different decade of frequency. That separation is the difference between a sensor that drifts and a measurement you can trust.
How it works
Impedance explorer
Randles equivalent circuit · 0.1 Hz – 200 kHz
Curves are computed from a textbook equivalent-circuit model, not measured data. When analyte binds to the immobilised antibody, the electrode surface is partly blocked and Rct rises — the widening semicircle is the signal. Drag the plot to inspect a frequency.
- Frequency
- —
- |Z|
- —
- Phase
- —
- fc (peak)
- —
- ΔRct (signal)
- —
Frequency-domain analysis
-
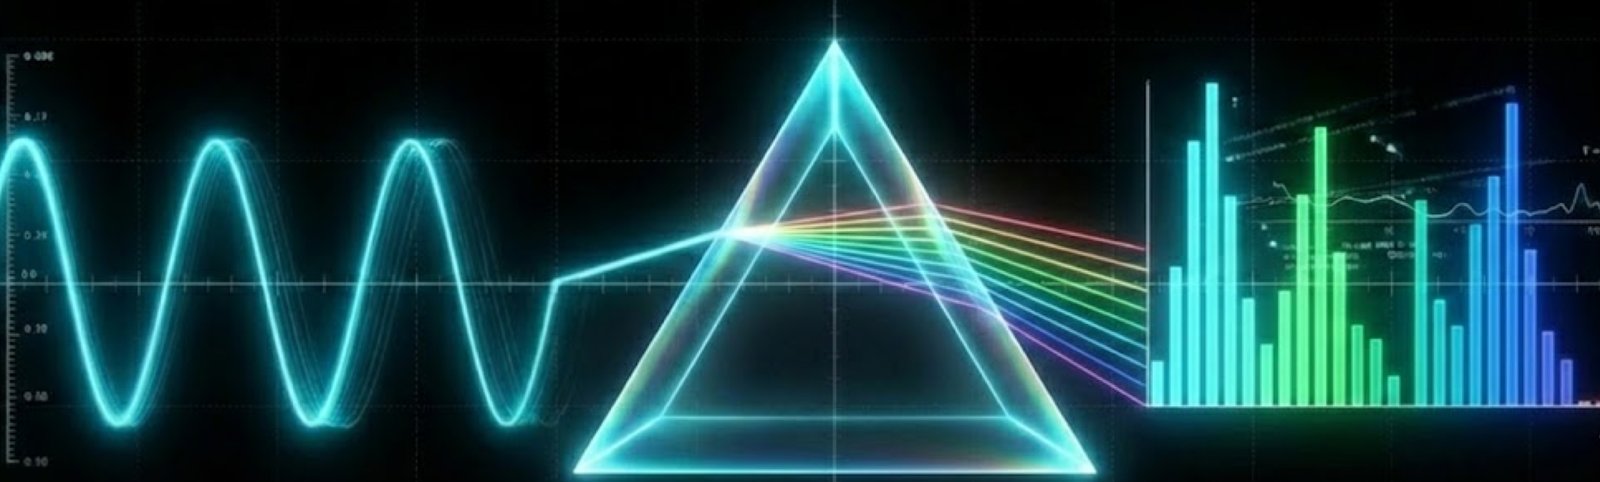
Fourier transform converts complex time-domain electrical signals into analysable frequency-domain data — like a prism separating white light into a spectrum.
-
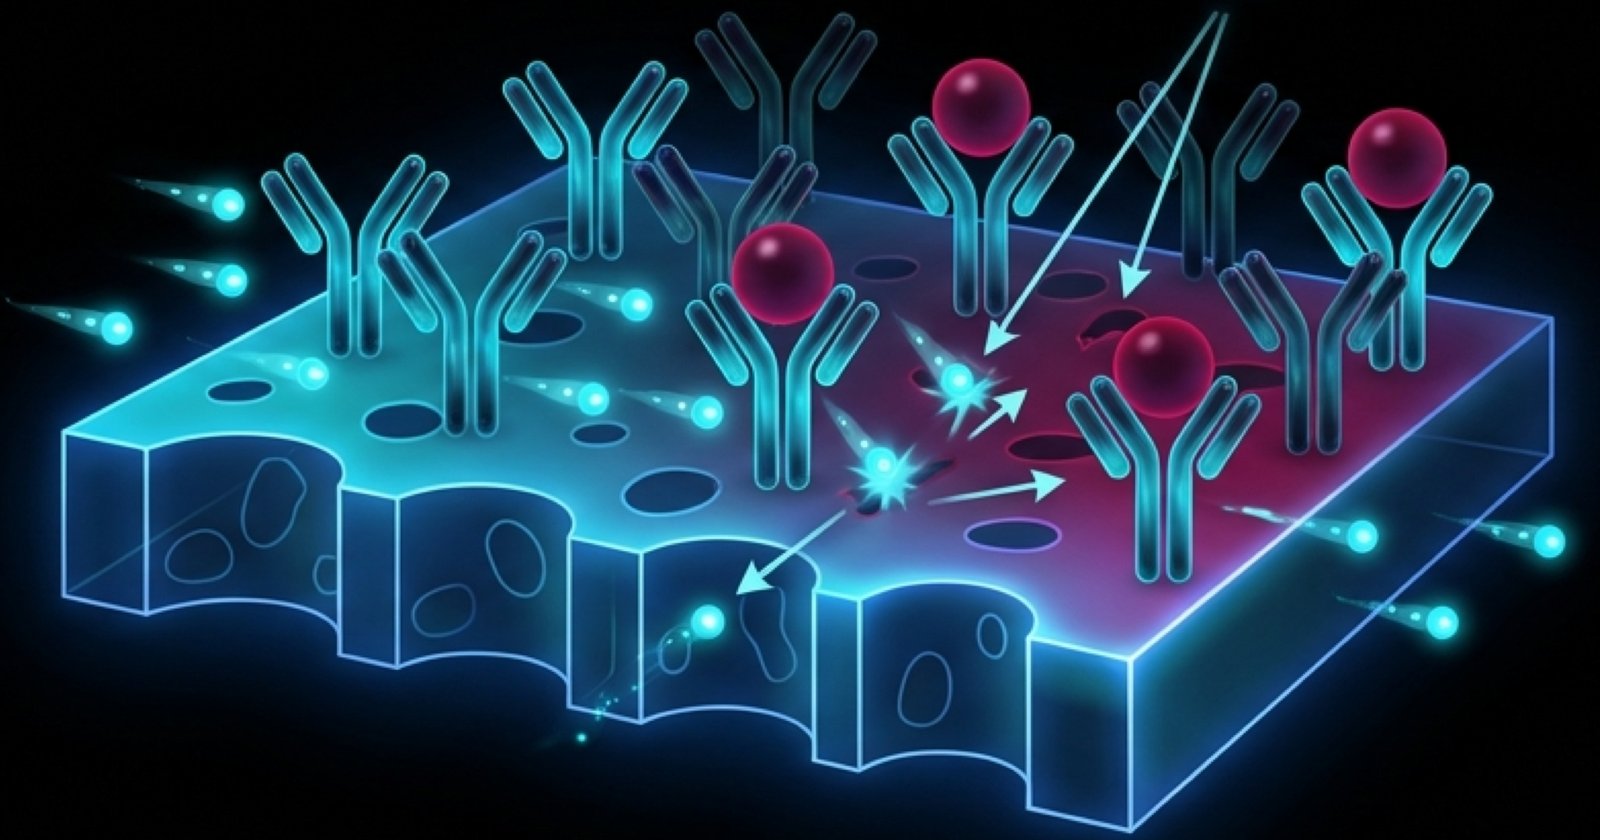
Picomolar sensitivity. High-precision biosensor applications detect minute changes in electrical resistance when target proteins bind to immobilised antibodies, enabling early diagnosis before symptoms appear.
-
Non-linear read-out. Machine learning reads the whole spectrum — raw magnitude and phase shift together — rather than a hand-fitted circuit, which is what removes the expert from the loop.
From electrode to inference
The same spectrum that reveals a binding event also carries the electrode’s own state. Separating the two is where the model earns its keep — and why the analysis runs on the chip rather than in a lab.
Technical parameters
- Measurement bandwidth
- 0.1 Hz – 200 kHz Published spec
- Measured quantity
- complex Z — |Z| and phase Published spec
- On-chip processor
- Arm Cortex-M4 Published spec
- Target sensitivity class
- picomolar (protein binding) Literature
- Classification accuracy
- > 95 % Published spec
Accuracy is a company-published figure, which is what its label says. Where a number comes from a peer-reviewed primary source instead, its row is labelled Literature. Nothing in this table is a measurement made on this page.
Applications
- Label-free immunoassay — protein biomarkers
- Hematocrit correction — blood glucose strips
- Electrode health — drift and fouling detection
- Cell and tissue impedance
- Wearable contact quality
Evidence
- Published spec Bandwidth, processor and measured quantity are as published for the impedance chip.
- Literature Charge-transfer resistance rising on antigen capture is standard electrochemistry; UCARETRON’s own aptamer-biosensor work is published in Anal. Chem. 2026 (doi:10.1021/acs.analchem.5c07608).
- Illustrative The impedance explorer above evaluates a Randles model live. It is a teaching instrument, not a data set, and no figure it produces is a specification.
Platform 02
Bio-Sensor
Electrochemical immunoassay, photothermal PCR, and cold-chain-free LAMP — next-generation molecular diagnostics designed to work outside the laboratory.
A molecular result that takes a day and a courier is a different product from one that takes twenty minutes at the bedside — even when the chemistry is identical. Getting there means attacking the two things that keep the laboratory big: the heater and the incubation.
How it works
Assay explorer
Lumped thermal model · Langmuir binding
Both tabs are computed illustrations — textbook models evaluated live so you can see which way a parameter pushes the physics. Neither is measured data and neither describes a specific UCARETRON product.
- Heating ramp
- —
- Cooling ramp
- —
- Cycle time
- —
- 40 cycles
- —
- T∞ reachable
- —
- KD
- —
- Incubation
- —
- Equilibrium
- —
- Limit of detection
- —
- Dynamic range
- —
Photothermal PCR
-
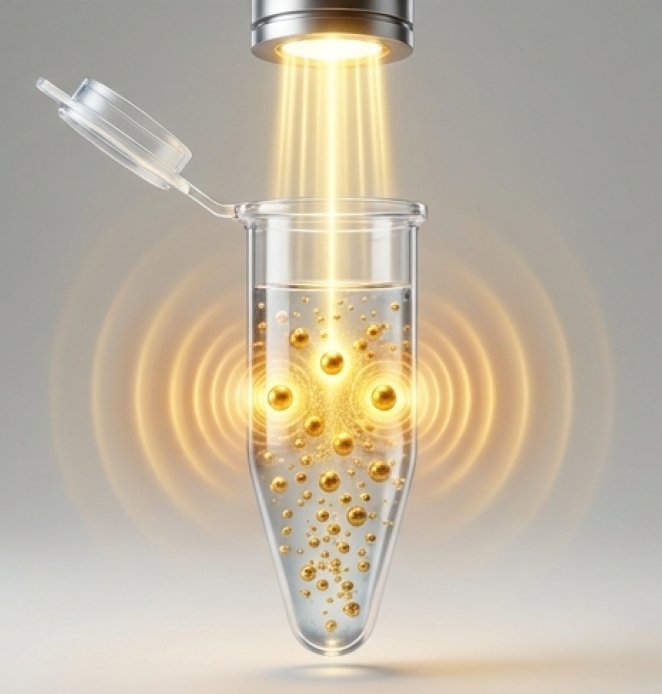
Plasmon resonance heating. Light hitting metal nanoparticles excites surface electrons, converting energy to localised heat instantly — precise thermal cycling without bulky hardware.
-
Under 250 g, under 25 minutes. From sample to smartphone, wherever the sample is taken.
-
Multiplex. Viruses and bacteria on one platform, with laboratory-grade accuracy at the point of care.
Electrochemical immunoassay
-
Smartphone-integrated. Antigen–antibody reactions become electrical signals. Apply a sample to a disposable strip; read the result immediately.
-
Thousands of times more sensitive than standard ELISA in the sandwich format — detecting virus even during the incubation period.
-
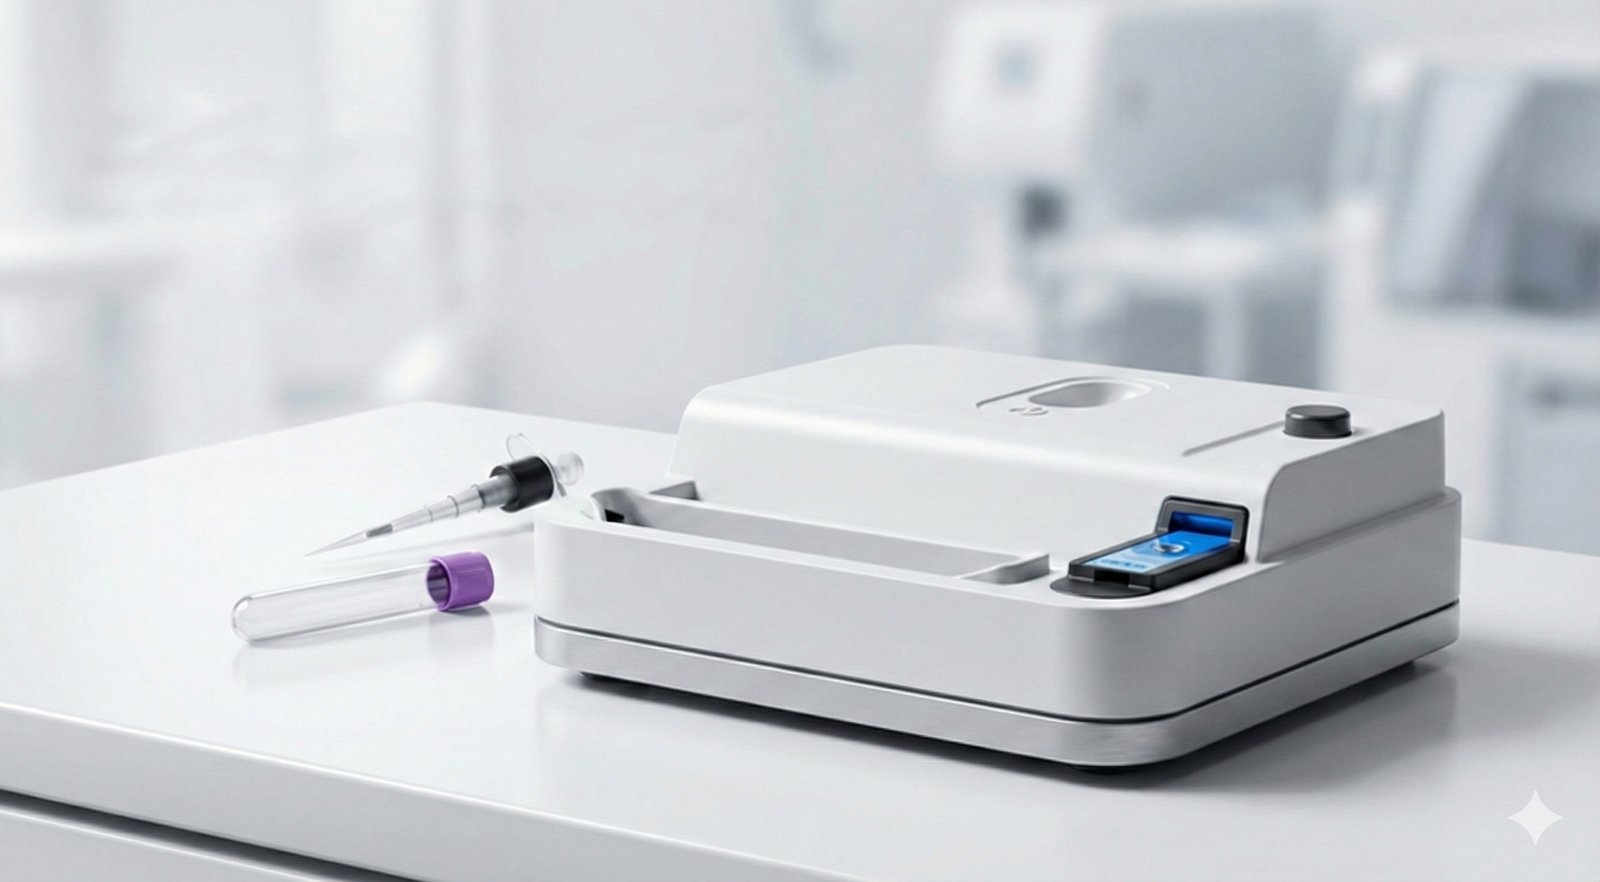
CARETRIX condenses laboratory equipment into a desktop device, bringing quantitative analysis to primary clinics without large-scale facilities.
Technical parameters
- Sample to answer
- < 25 min Published spec
- Instrument mass
- < 250 g Published spec
- Amplification
- photothermal PCR · cold-chain-free LAMP Published spec
- Immunoassay format
- sandwich, electrochemical read-out Literature
- Multiplexing
- viral and bacterial targets, one cartridge Published spec
- CARETRIX analyser
- IVD Class 1 · UCT-IMRCT-01 Public record
The comparative sensitivity claim against standard ELISA is a company statement about the sandwich format, not a figure from a controlled head-to-head study published here.
Applications
- Respiratory panels — point of care
- High-risk infectious agents — CARETRIX DYC
- Field and pharmacy testing — no cold chain
- Primary clinics — quantitative immunoassay
- Veterinary and food safety
Evidence
- Public record CARETRIX immunoassay analyser, IVD manufacturing notification Class 1, 체외 제신 25-1214 호; CARETRIX DYC kit, IVD manufacturing approval Class 3, 체외 제허 25-686 호. Manufactured under ISO 13485:2016 and KGMP — numbers and validity on the Evidence section.
- Literature Plasmonic photothermal heating and isothermal LAMP amplification are established in the primary literature; this platform applies them, it does not claim to have discovered them.
- Published spec Time-to-answer and instrument mass are published platform specifications.
- Illustrative The assay explorer computes a lumped thermal model and a Langmuir binding curve. Its detection limits and cycle times describe the model, not a product.
Platform 03
AI Analysis
Precise biometric data processing — from fingerprint restoration to multimodal biosignal integration for security and healthcare.
Most biometric systems discard whatever is not clean. The evidence that matters is usually the part that was thrown away: a partial print, a smudged one, two prints on top of each other. Recovering structure from those is a different problem from matching a good scan, and it is the one worth solving.
How it works
Ridge lab
Procedural ridge fields · two problems, drawn
Both tabs are symbolic illustrations. The ridge fields are generated procedurally — no real print is shown — and the “recovered” panel is simply the field the generator started from. This shows what the task is, not how TruePrint does it, and makes no claim about accuracy.
- Degradation
- —
- Usable ridge area
- —
- Separation
- —
- Layers resolved
- —
Push it far enough and the left panel stops looking like a print at all. The right panel is what a restoration step has to put back.
Unmixing is not filtering: both layers are real ridges, and the only thing separating them is that they follow different flow fields.
TruePrint
-
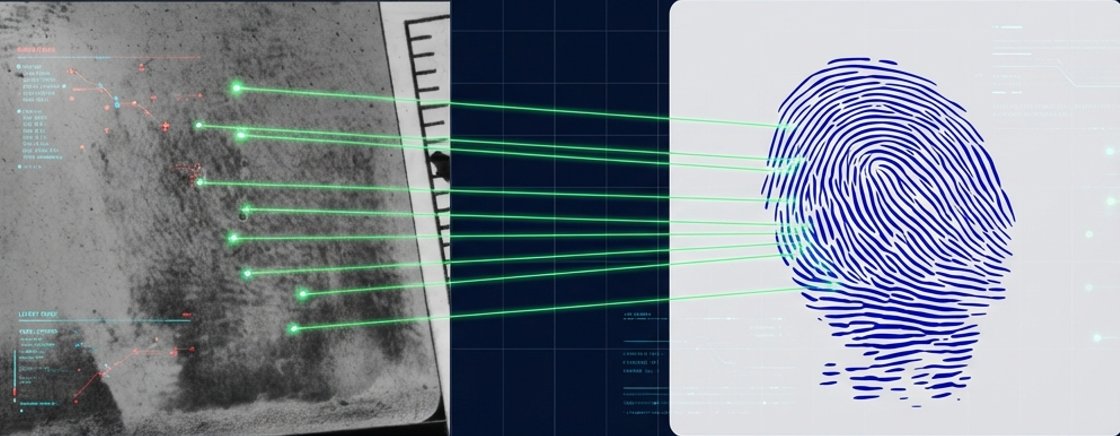
Ridge restoration. AI reconstructs clear ridges from noisy, incomplete latent prints — recovering evidence traditional forensic methods cannot process.
-
Layer separation. A world-first technique that unmixes overlapping fingerprints into distinct individual layers.
-
Multimodal. Fingerprint, fundus imaging and EEG converge on one platform for next-generation security and diagnostics.
Multimodal integration
TruePrint Lab has been shown at major technology exhibitions, demonstrating real-time AI fingerprint extraction and analysis to industry partners worldwide. Fundus and EEG are the declared next modalities on the same platform.

Technical parameters
- Shipping product
- TruePrint Lab v1.0 Public record
- Software quality grade
- GS certification, Grade 1 (TTA) Public record
- Procurement status
- Innovative Product designation (KNPA) Public record
- Primary task
- latent ridge restoration Published spec
- Second task
- overlapped-print layer separation Published spec
- Declared modalities
- fingerprint · fundus · EEG Design intent
“World-first” for layer separation is a company statement. Certification numbers and validity dates are reproduced from the issuing documents in the Evidence section.
Applications
- Forensic latent-print recovery
- Overlapped-impression casework
- Public-procurement identity systems
- Fundus-based screening
- EEG biosignal fusion
Evidence
- Public record TruePrint Lab v1.0 — GS quality certification Grade 1, No. 23-0440; Innovative Product designation for public procurement, No. 2024-034.
- Literature Latent-space modelling work with UCARETRON affiliation is published in Int. J. Biol. Macromol. 2024 (doi:10.1016/j.ijbiomac.2023.127884).
- Design intent Fundus and EEG on the same platform is a stated direction. The shipping, certified product is the fingerprint pipeline.
- Illustrative Every ridge field in the lab above is procedurally generated. No real print appears on this page and no accuracy figure is claimed from it.
Platform 04
BEAT Connected
A connected bio-electric platform for the nervous system. It listens — heart-rate variability, nerve-conduction timing, a drawn trace — lets a model infer state, and answers with precisely phased stimulation across wirelessly synchronised nodes.
Open-loop stimulation runs to a timer and the body learns the pattern. Closing the loop means two hard things at once: measuring the nervous system well enough to decide, and delivering a pattern that never quite repeats. Both are timing problems, which is why they are solved with phase rather than amplitude.
How it works
Stimulation explorer
Phase-controlled nodes · relative conduction timing
Design intent, drawn. These two views illustrate mechanisms described in the public patent record. They are computed waveforms, not recordings, and BEAT Connected is offered for personal wellness — nothing here is a clinical claim.
- Composite peak
- —
- Phase offset
- —
- Inter-node delay
- —
- Balance
- —
- Pathway 1
- —
- Pathway 2
- —
- Relative time
- —
- Response amplitude
- —
- Contact impedance
- —
Sense → infer → stimulate
-
Closed loop from heart to head. A wearable ECG sensor streams heart-rate variability; a model estimates the likelihood of an anxiety episode and, only then, shapes a cranial electrical-stimulation pattern — stimulation as a response to a measurement, not to a timer.
-
Stereo, phase-controlled nodes. Two or more stimulation nodes are linked and synchronised wirelessly; the controller drives them with deliberately different phases, with adjustable delay and balance — so the body is never offered one repeating pattern to habituate to.
-
Nerve function as a timing measurement. Simultaneous stimuli on two neural pathways are phase-shifted until the brain perceives them as one; that shift is a relative conduction time. Skin-impedance dependence is removed, so the reading reflects the nerve, not the electrode contact.
-
Psychological state from a drawn trace. A companion app shows an image, lets it fade, and asks the user to redraw it; reaction time, overlap and shape are analysed by AI, which then proposes coping strategies.
- Frequency
- —
- |Z|
- —
- Phase
- —
- Reading
- —
- Membrane crossing
- —
Technical parameters
- Control loop
- HRV inference → conditional stimulation Design intent
- Node topology
- multi-node, one wireless clock Design intent
- Stimulation parameter
- phase offset, delay and balance Design intent
- Nerve read-out
- relative conduction time between pathways Design intent
- Protected mechanisms
- 4 filings · 3 registered Public record
Every row in this table is design intent from the public patent record. BEAT Connected is offered for personal wellness; it is not a substitute for clinical diagnosis or treatment, and no clinical efficacy is claimed anywhere on this site.
Applications
- Personal wellness — stress and sleep support
- Nerve-function self-check
- Drawn-trace state tracking
- Research instrumentation
Evidence
- Public record HRV-driven cranial stimulation KR 10-2965810; phase-controlled multi-node stimulator control KR 10-2459338; nerve-function diagnostics by relative conduction timing KR 10-2906148; drawing-based psychological analysis KR 10-2022-0069400 · PCT (pending). See the Evidence page.
- Literature Low-intensity electric-field stimulation work with UCARETRON affiliation is published in Tissue Eng Regen Med. 2026 (doi:10.1007/s13770-025-00778-x).
- Design intent The four mechanisms are described as designed, not as clinically validated. No efficacy or safety claim is made from them.
- Illustrative The waveforms and the coincidence curve in the explorer are computed, not recorded.
Work with us
Which platform fits your problem?
Send us the measurement you cannot make today.